The software used in conjunction with the NHT 310 meter, provides the remote management of the meter via optical fiber on PC through Optical/USB converter.
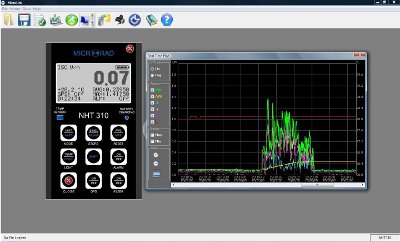
The software is direct and intuitive. It graphically displays the amplitude/time output and reproduces the user interface in real time. Complete with keyboard and graphic display, and provides the table with all the data related to monitoring.
The data measured via single or multiple monitoring are listed in a table providing the following information:
NHT 310 incorporates a GPS module for acquiring geographic coordinates which refer to the measurements taken. The MicroLink software can be automatically displayed using Google MapsTM.
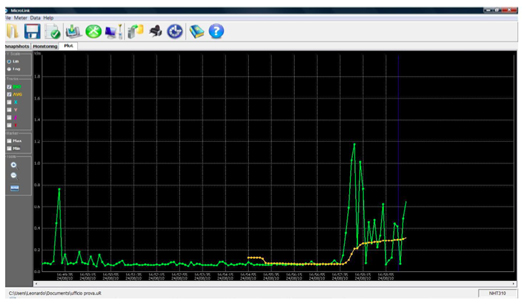
In the amplitude/time mode pan, zoom, min and max functions are available, and the operator can select linear or logarithmic scale.
The graph allows the display of each single axis, the resulting, of the mean and temperature value.
Additional software functions:
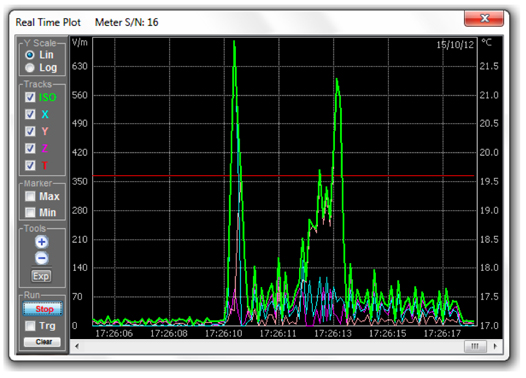
The EMC Viewer allows the user to connect to a virtually unlimited number of sensors (currently configured for up to 8 sensors simultaneously).
The software is simple and intuitive, it displays the current values and trends time/frequency allowing to export data and images.
Displayed information:
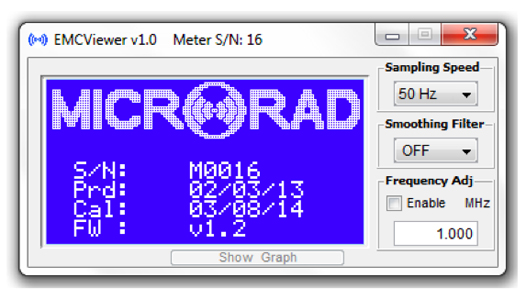
Start-up phase of the user interface
Other functions:
Exp button allows the operator to export as an image file of the graph currently displayed, or export the data in Excel format.
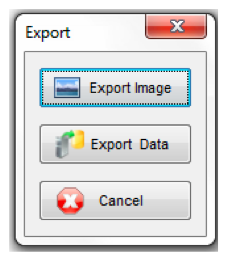
Export menu